GeoPandas is an open source package that allows analyzing geospatial data in Python more convenient. Previously, data was processed in Python, output in csv or xlsx format, and then spatial data analysis was performed using QGIS or ArcGIS. Now with using GeoPandas, spatial data processing and analysis can be performed simultaneously on the same platform.
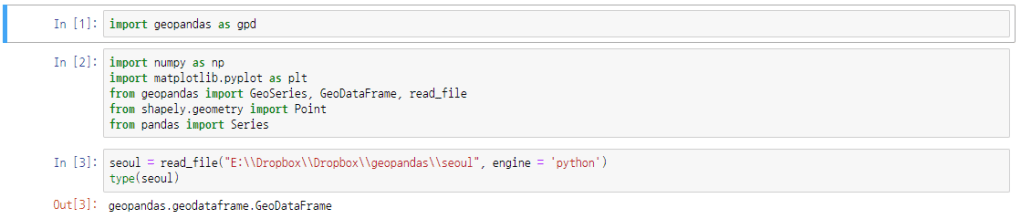
After installing the packages sequentially, call Geopandas package and other required packages. I first uploaded the ‘Seoul Living Population( SLP)’ data into the Census Tally Districts (CTDs) of Seoul as a tutorial.
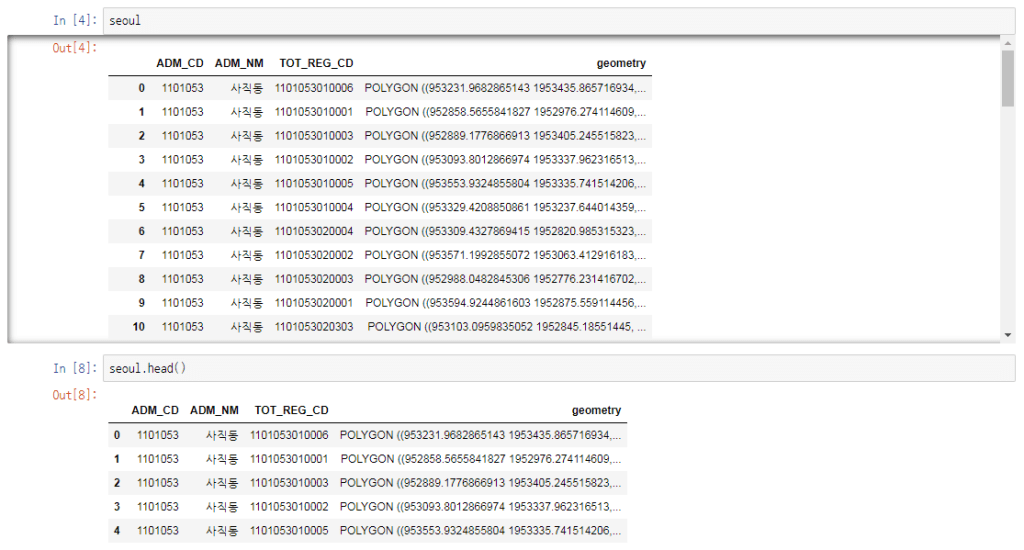
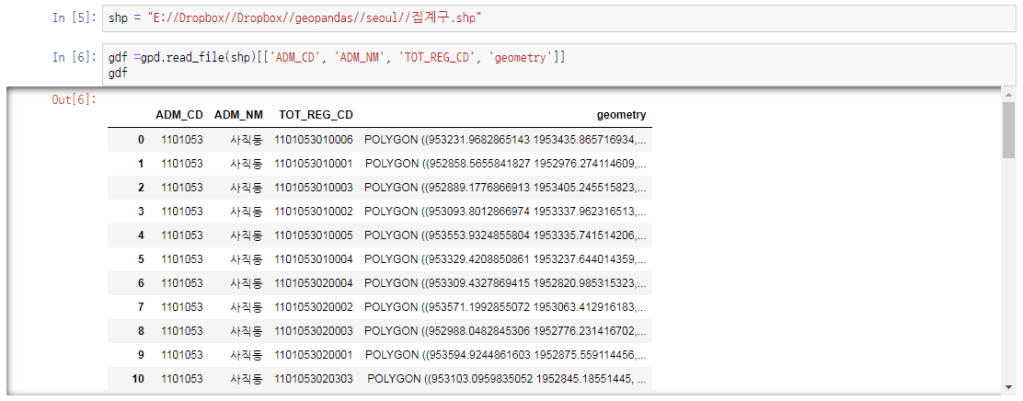
Then upload shapefile to integrate with SLP Data using “merge” function in pandas.
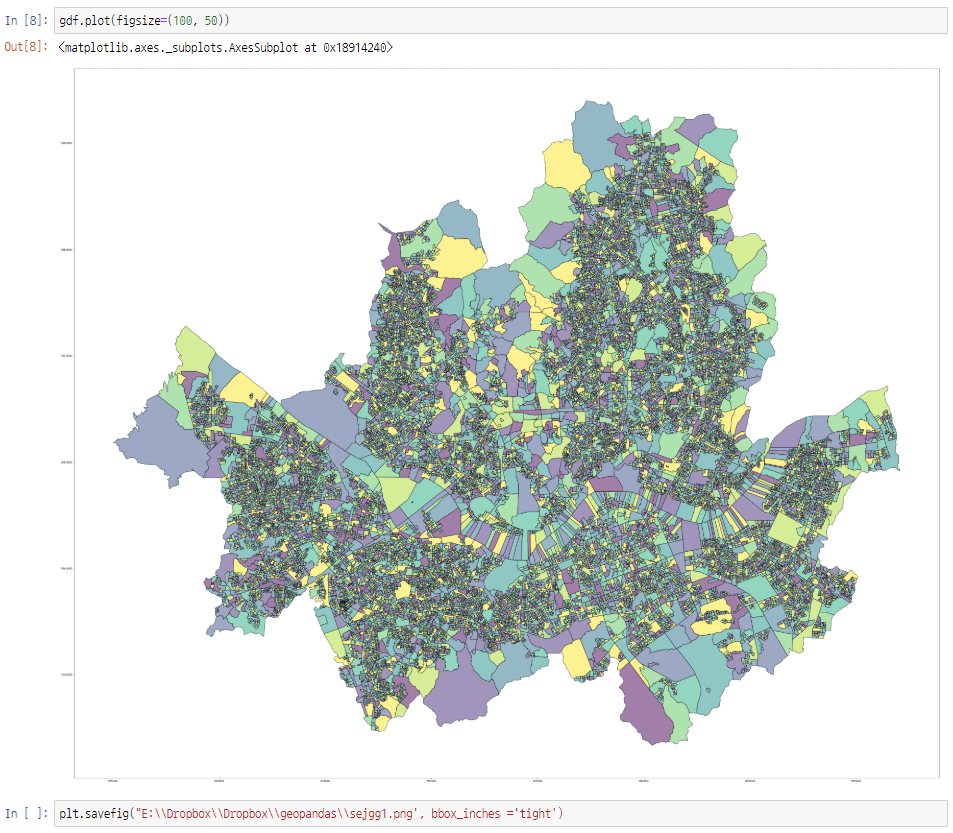
In the following, you can see that 19,153 CTDs were successfully plotted.
(The Matplotlib package allows you to resize images.)