This article aims to distinguish between areas which are frequently visited by those infected with COVID-19 from those that are not and visualize their distribution using data about the locations of those who have been diagnosed as being infected by COVID-19.
The Korean government collects data, such as mobile phone location and credit card usage information, to track COVID-19 patients’ travel. This data was published on government websites to encourage people to avoid high-risk locations.
A hot-spot analysis was conducted based on this data to determine the where those infected with COVID-19 went immediately before they showed symptoms or after the onset of symptoms before hospitalization.
The Getis-Ord Gi* statistic was used to classify regions. The results were visualized using the COUNT_INCIDENTS_WITHIN_FISHNET_POLYGONS function of ArcMap 10.3 (Fig. 1).
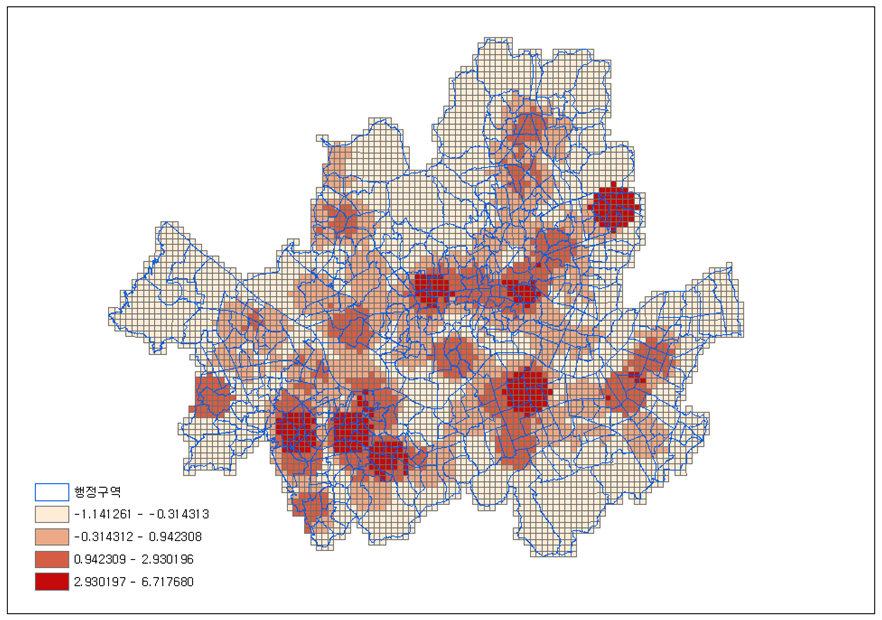
The analysis showed that the most frequently visited locations were the Sillim area near Seoul National University and the Guro area in southwestern Seoul, the downtown area in northern Seoul, and the Gangnam area in southeastern Seoul where call center group infection occurred.
These areas were concentrated in the downtown or suburban areas of Seoul, which have high concentrations of urban workplace and commercial areas, indicating that the hot spots most visited by the infected were business and commercial areas rather than residential areas.
