Since the first confirmed case of COVID-19 in South Korean in January 2020, there has been a great deal of fear and anxiety around the possibility of COVID-19 transmission when using public transportation, such as subways.
In this study, I used the K-shape clustering algorithm to determine how public transportation users’ ridership changed in response to the number of confirmed cases.
The K-shape clustering algorithm is used to cluster time-series data. Unlike the K-means clustering algorithm, which classifies clusters based on homogeneity between individual observations using Euclidian distance, the K-shape clustering algorithm uses dynamic time warping (“DTW”) method.
The DTW method more accurately measures the sequence of time-series data because it searches for the point of the phase most similar to each point instead of the point corresponding to the mean value (Fig. 1).
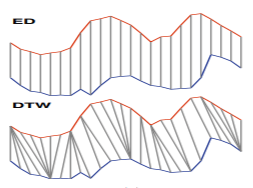
<Figure 1> Difference between ED and DTW method
I used the tslearn Python’s package.(https://tslearn.readthedocs.io/en/stable/gen_modules/clustering/tslearn.clustering.KShape.html)
In order to use tslearn, the numpy package must be upgraded. However, re-installing the newest version over version 1.15 will result in the array function not executing due to a conflict within the system. Thus, to use the tslearn package, delete numpy version 1.15 and install version 1.16 or higher.
A total of 97 days’ worth of data was analyzed, from January 20, which is when the first confirmed case occurred, to April 25. The x-axis units are days. The y-axis units are the total number of trips per day taken from 506 stations.
A seed value of k = 3 was set before the hierarchical cluster analysis was conducted. The results of using z-score standardization in the clustering process were as follows (Fig. 2).

Even after standardization, there was a marked decrease in the number of subway trips in all three clusters since mid-February, which was when a large-scale outbreak occurred in Daegu. It was not until the beginning of April that the number of trips began to increase.
** Reference
Paparrizos, J., & Gravano, L. (2015, May). k-shape: Efficient and accurate clustering of time series. In Proceedings of the 2015 ACM SIGMOD International Conference on Management of Data (pp. 1855-1870).
